Are you seeking insights into your brand's online presence and performance? Berify offers a powerful suite of Data & Analytics tools to help you do just that. With a few simple steps, you can access and make sense of valuable data that can inform your marketing strategies and decision-making processes.
Tutorial: Mastering Berify's Data & Analytics Dashboard
Accessing Berify's Data & Analytics
To get started, navigate to your Berify Dashboard, where you can access a wealth of information about your brand. Once you are on the dashboard, look for the "Analytics" section and click on it to delve deeper into the data.
Click on the designated icon to explore the analytics features Berify provided. This will open up a world of possibilities for understanding how your brand is perceived online and how it can be improved.
Exploring the Analytics Features
Once in the Analytics section, you can refine your search by clicking on specific tabs such as "NFT Distribution" and "Batch Analytics." These tabs offer unique insights into your brand's online presence and audience engagement.
Remember to explore the "Scan Data" and "Scan Distribution" options to gain deeper insights into your brand's digital footprint and performance. By analyzing data from different timeframes, such as "Last day" and "All Time," you can track trends and patterns that can inform your marketing strategies.
Exporting Data and Insights
Once you have explored and analyzed the data satisfactorily, you can export the findings by clicking on the "Data Export" option. This feature allows you to save the insights for future reference or share them with your team for collaborative decision-making.
With Berify's Data & Analytics tools, you can take your brand's online presence to the next level and make informed decisions that drive growth and success. So, what are you waiting for? Dive into the world of data-driven insights with Berify!
Understanding Your Brands Analytics
The Berify Dashboard offers a robust analytics suite to provide brands with real-time, actionable insights into customer behavior, product performance, and engagement trends. By leveraging features like heat maps, scan rates, and community analytics, brands can make data-driven decisions to enhance customer experience and drive growth. Below is a comprehensive guide to understanding the analytics features available in Berify.
1. Heat Map Analytics
Definition:
The heat map visually represents consumer activity by highlighting geographical hot spots. This powerful tool shows where consumers are engaging with your products in real-time.
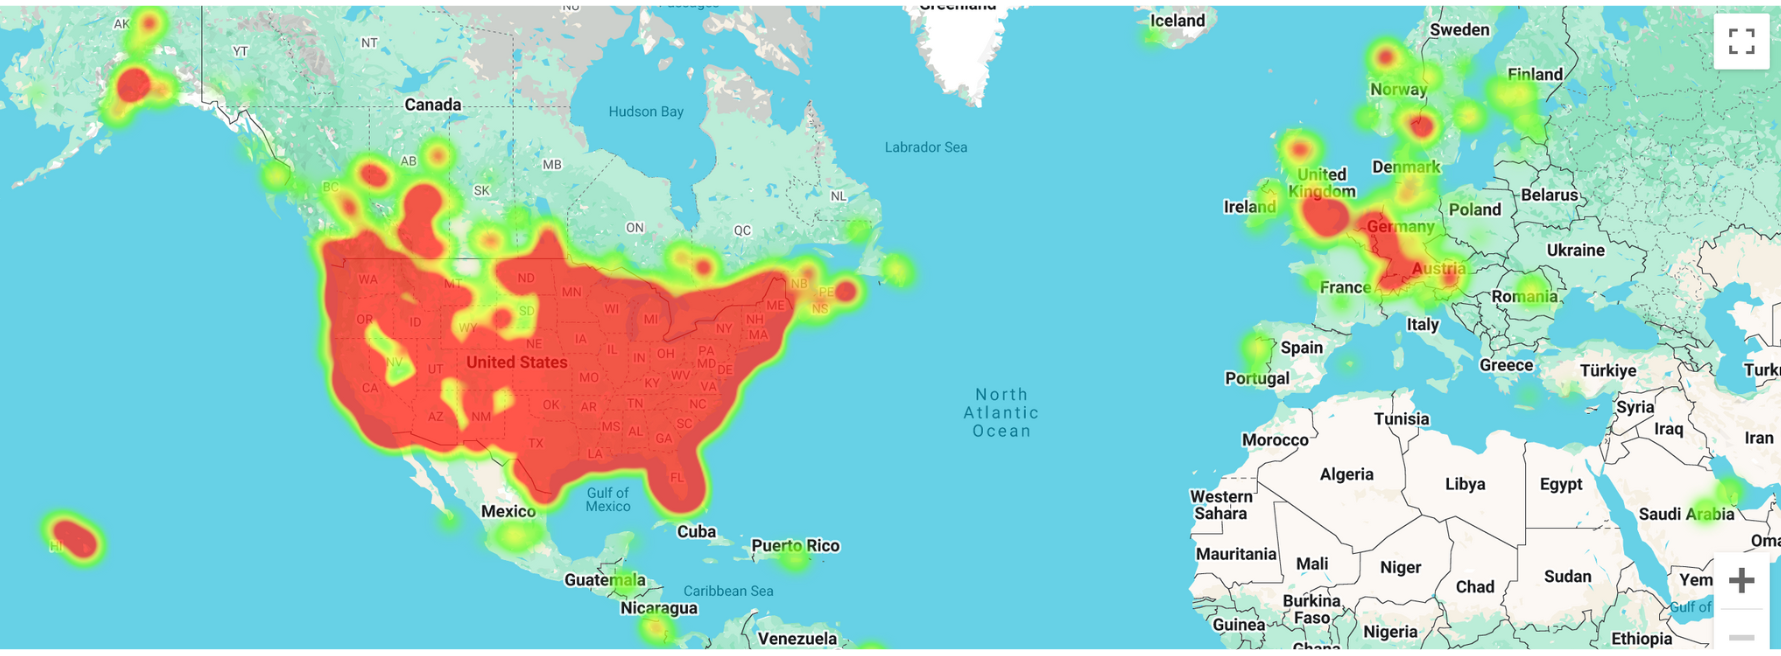
How It Helps:
- Pinpoints high-engagement regions for targeted marketing.
- Tracks the effectiveness of localized campaigns.
- Offers a global or filtered view of engagement over the last month, week, hour, or all time.
2. Scan Rate
Definition:
The scan rate measures the frequency of smart tag interactions.
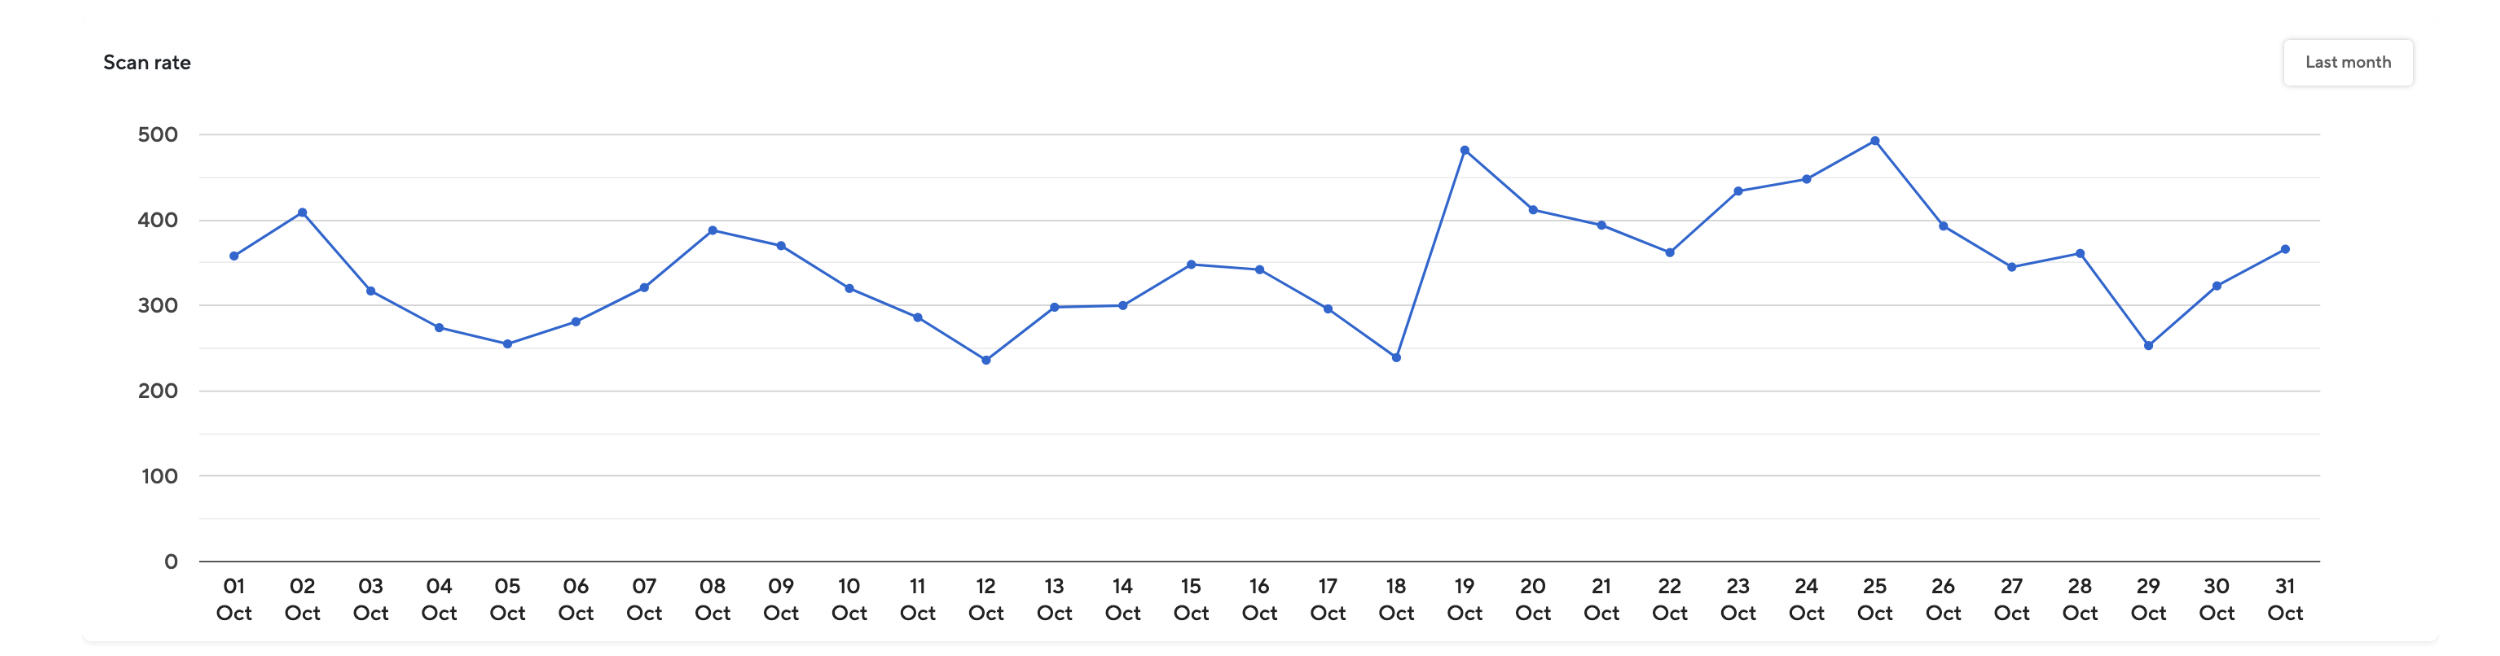
How It Helps:
- Measure Engagement Levels: Track how often customers interact with your smart tags to gauge the effectiveness of your product packaging, marketing campaigns, or promotional materials.
- Identify High-Performing Products: Products with higher scan rates indicate strong consumer interest and can guide inventory management, marketing focus, and future product development.
- Assess Campaign Effectiveness: Use scan rate data to evaluate the impact of your promotional efforts in real-time and adjust strategies to improve engagement.
- Enhance Regional Marketing: Combine scan rate data with heat map analytics to identify regions with high or low engagement, allowing you to target specific areas with tailored campaigns.
By regularly monitoring and acting on scan rate insights, your brand can fine-tune its approach to maximize consumer interactions and improve overall marketing ROI.
3. Real-Time Data
Definition:
Real-time data collection ensures all interactions are tracked and displayed immediately.
Context:
- Brands gain immediate visibility into scan details across all smart tags.
- Data range depends on consumer permissions and interaction type.
- Enables agile decision-making based on up-to-the-minute insights.
4. Zero-Party Data
Definition:
Zero-party data, such as preferences or feedback, is voluntarily provided by customers.
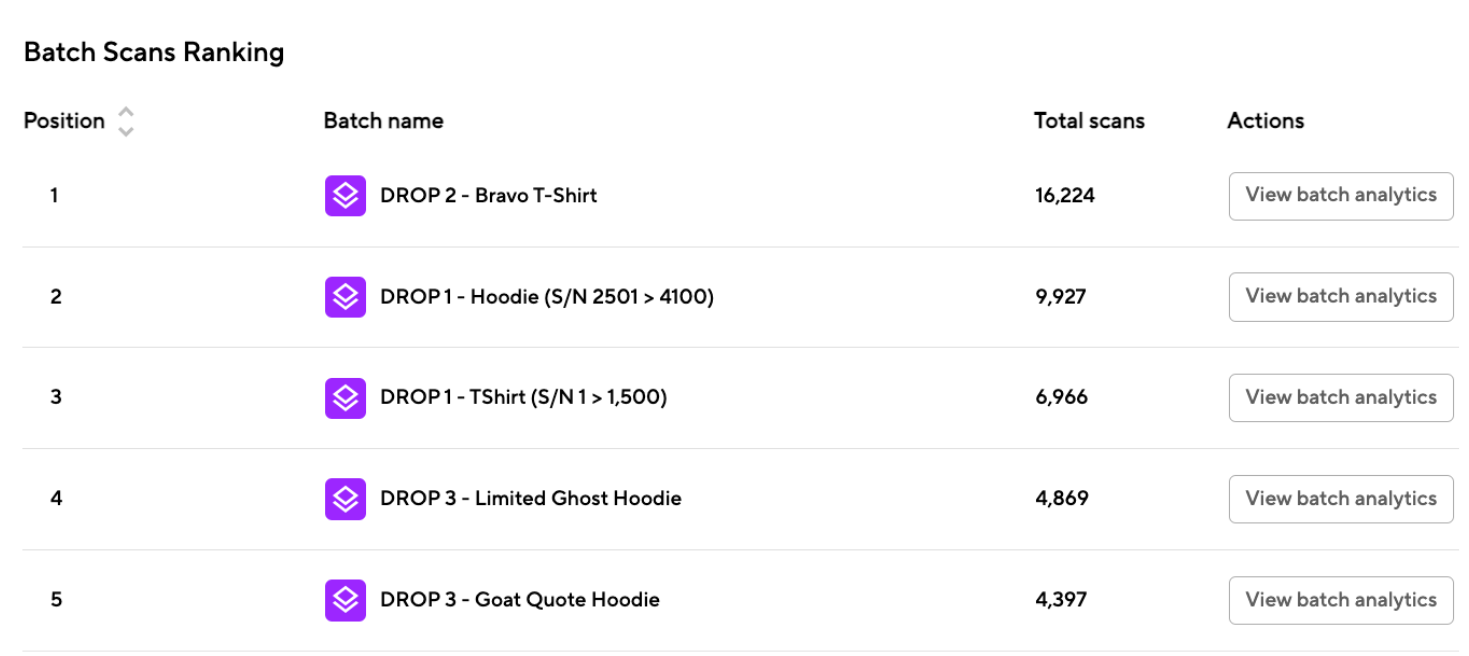
5. Product-Specific Analytics
Batch Performance Ranking:
Identifies the top-performing product batches based on interaction rates.
- Batch Scans Ranking: Reveals which products receive the most consumer engagement.
6. Overall Brand Analytics
Monitor overall scan performance trends to identify engagement patterns across all batches.
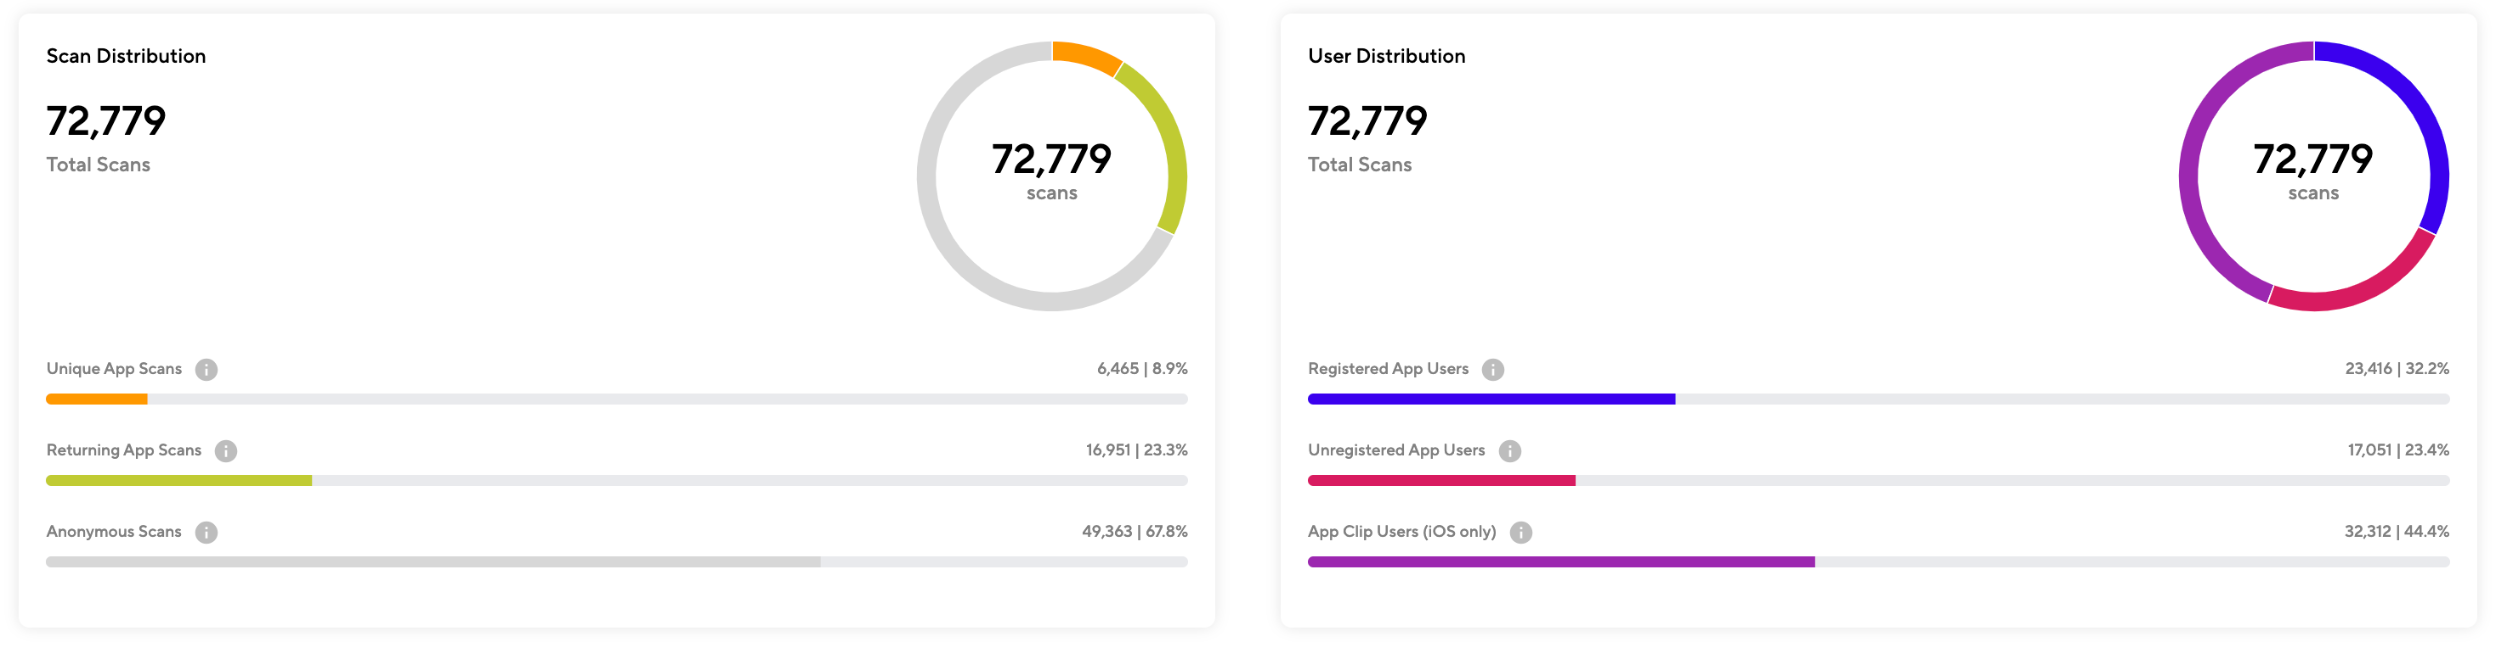
Metrics Tracked:
- Unique Scans: Total first-time scans by different users.
- Returning Scans: Scans from logged-in users after their initial interaction.
- Anonymous Scans: Scans from users not logged in or using the App Clip, with no differentiation between first-time or repeat scans.
- Registered App Users: Scans by users logged into the app.
- Unregistered App Users: Scans by users not logged in.
- App Clip Scans: Scans performed using the iOS App Clip feature.
7. NFT Redemption Analytics
Tracks the redemption of NFTs linked to your products:
- NFTs Minted: Displays the visual breakdown of users who have redeemed or not redeemed their NFTs.
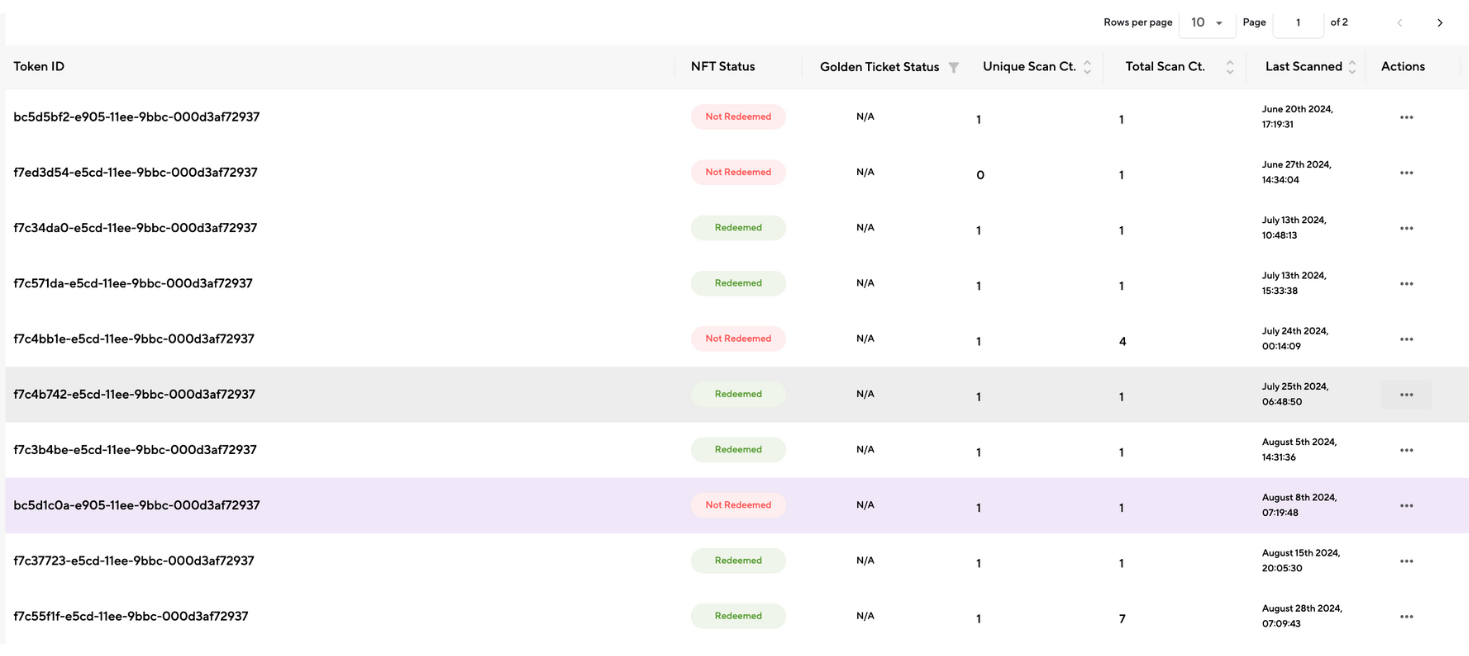
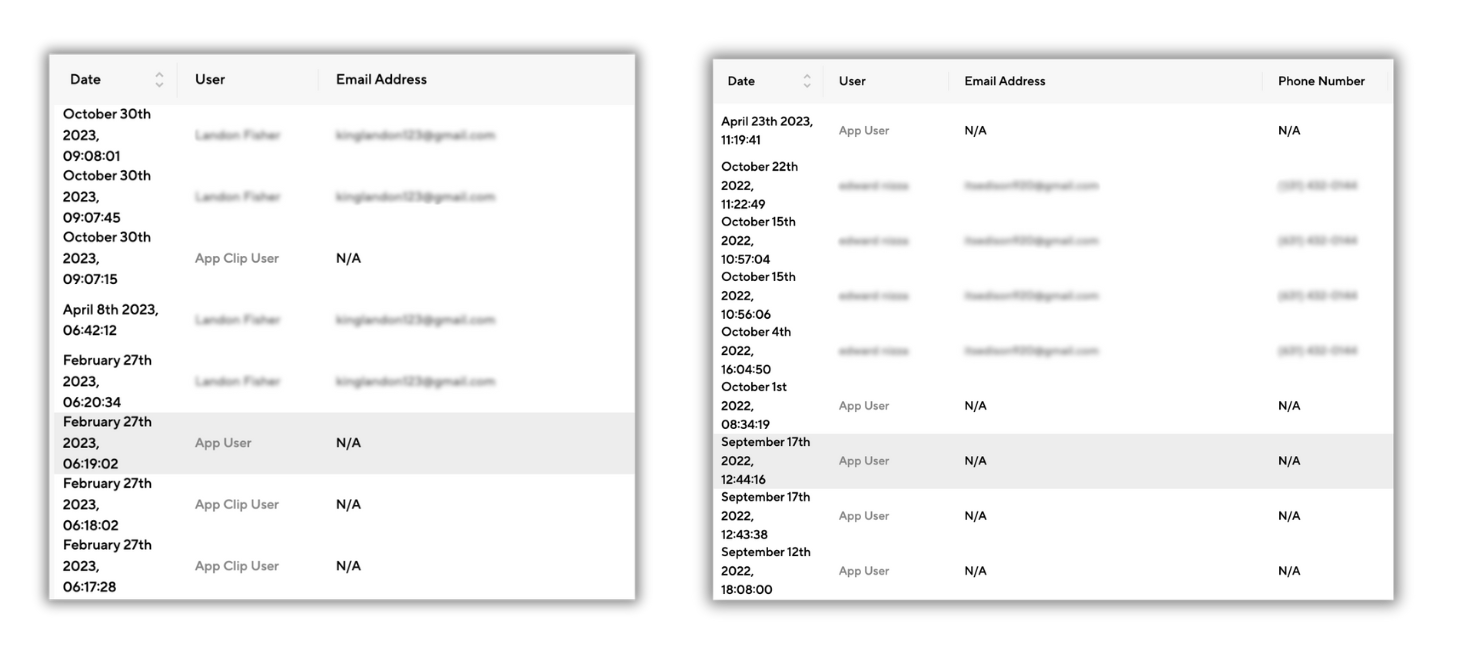
8. Individual Customer Journeys
Provides a detailed view of individual tag scan activity:
- Tracks the journey from an initial App Clip scan or app scan to profile registration.
- Aggregates increasingly valuable customer data over time.
9. Community Analytics
Fosters brand engagement through social interaction:
- Consumers scanning the same products can post comments and interact.
- Brands can reply to comments and moderate interactions directly from the dashboard.

Using Analytics for Strategic Growth
By leveraging Berify's analytics tools, brands can:
- Identify key markets and customer preferences.
- Improve product engagement with targeted campaigns.
- Build stronger customer relationships through community interactions.
- Optimize product placement and marketing strategies based on real-time insights.